
- Imprimer
- Partager
- Partager sur Facebook
- Partager sur Twitter
- Partager sur LinkedIn
- Share url
Eq J.Bastin
Le 21 juin 2021
De nouveaux résultats obtenus par l'équipe "Cerveau, Comportement et Neuromodulation" et publiés dans Nature Communications
La question de savoir si la maximisation des récompenses et la minimisation des punitions reposent sur des systèmes cérébraux distincts reste débattue, étant donné les résultats contradictoires provenant d'études de neuroimagerie humaine et d'électrophysiologie animale. Pour combler le fossé entre ces techniques, les chercheurs de l’équipe "Cerveau, Comportement et Neuromodulation" dirigée par Julien Bastin ont réalisé une nouvelle expérience dont les résultats ont été publiés dans la revue scientifique Nature Communications.
Les chercheurs ont enregistré l'activité intracérébrale de vingt participants pendant qu'ils effectuaient une tâche d'apprentissage instrumental. Ils ont constaté que les erreurs de prédiction de la récompense et de la punition (PE), estimées à partir de la modélisation des choix comportementaux, présentent une corrélation positive avec l'activité gamma (BGA) dans plusieurs régions du cerveau.
Dans tous les cas, l'activité gamma était proportionnelle au feedback monétaire (récompense ou punition versus feedback neutre) et était négativement corrélé aux signaux de prédiction (prévisibilité de la récompense ou de la punition).
Cependant, les PE de récompense étaient d’avantage signalés dans certaines régions (comme le cortex préfrontal ventromédial et le cortex orbitofrontal latéral), et les PE de punition dans d'autres régions (comme l'insula antérieure et le cortex préfrontal dorsolatéral). Ces régions pourraient donc appartenir à des systèmes cérébraux qui contribuent de manière différentielle à la répétition des choix récompensés et à l'évitement des choix punis.
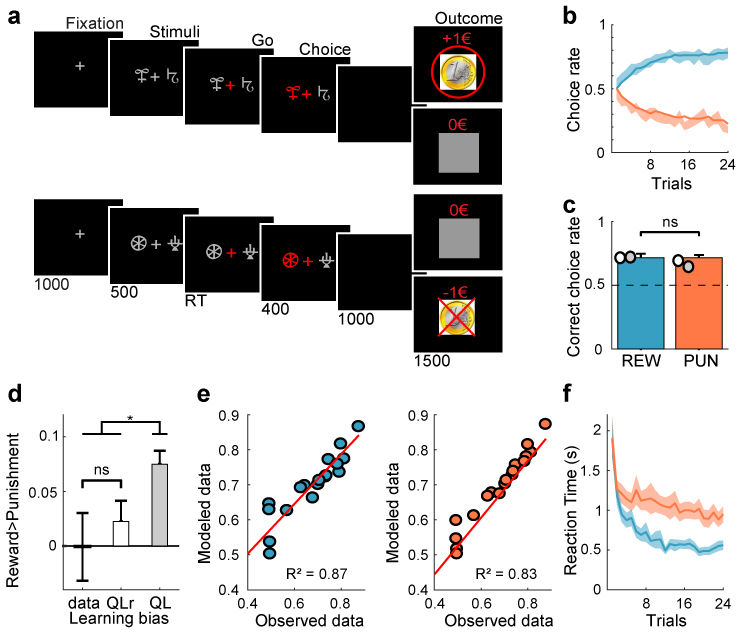
a Successive screenshots of a typical trial in the reward (top) and punishment (bottom) conditions. Patients had to select one abstract visual cue among the two presented on each side of a central visual fixation cross, and subsequently observed the outcome. Duration is given in milliseconds. b Average learning curves (n=20 patients). Modeled behavioral choices (solid line) are superimposed on observed choices (shaded areas represent mean ± SEM across patients). Learning curves show rates of correct choice (75% chance of 1€ gain) in the reward condition (blue curves) and incorrect choice (75% chance of 1€ loss) in the punishment condition (red curves). c Average performance (correct choice rate, n =20 patients). Modeled performance is indicated by white and gray disks (using Q-learning+repetition bias and basic Q-learning model, QLr and QL, respectively). Dots represent individual patients. d Difference between conditions (reward minus punishment correct choice rate) in observed and modeled data. Dots represent individual patients and error-bars represent mean ± SEM across patients (n = 20). e Inter-patient correlations between modeled and observed correct choice rate for reward (blue) and punishment (red) learning. Each circle represents one patient. Red line represents the linear regression across patients (n = 20). f Reaction time (RT) learning curves. Median RT are averaged across patients and the mean (±SEM) is plotted as function of trials separately for the reward (blue) and punishment (red) conditions. Black horizontal bars represent the outcome of two-sided statistical tests of difference, using paired Student’s t tests in c and d. ns means not significant and asterisk indicates significance in d (QL>QLr, p=0.0037; QL>data, p=0.013).
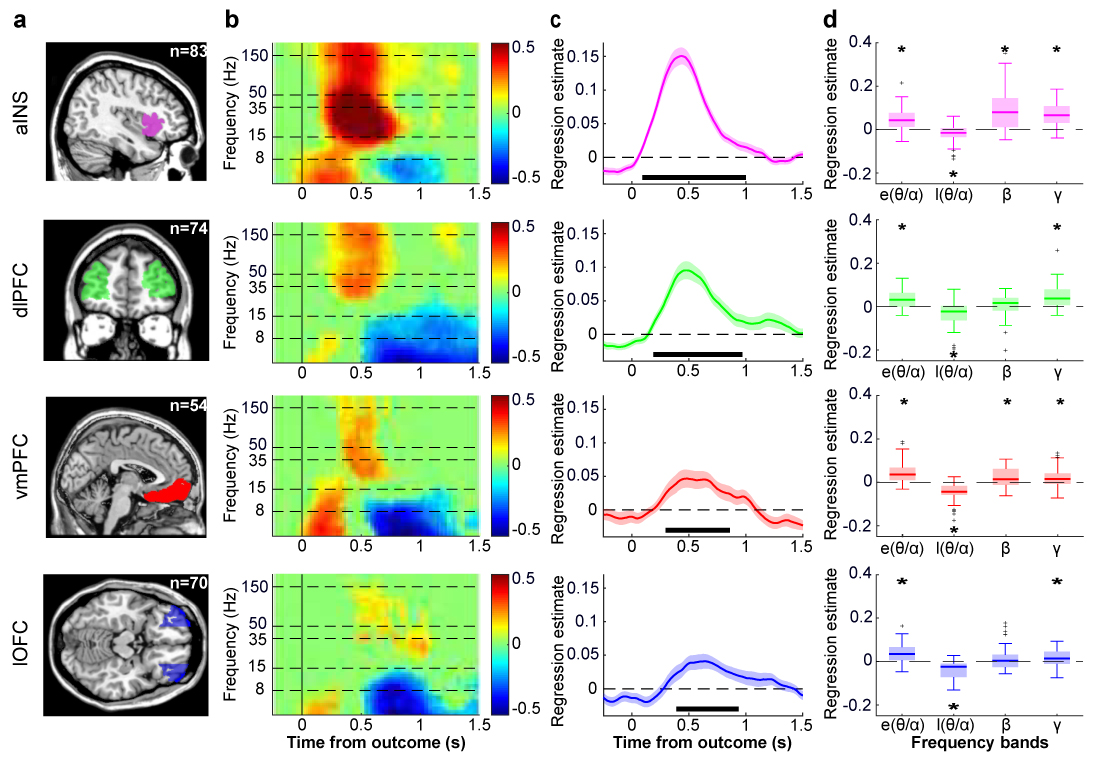
a. Anatomical localization of the aINS (purple), dlPFC (green), vmPFC (red), and lOFC (blue). All recording sites located in these parcels were included in the ROI analyses. The sample size used to derive statistics in panels b–d are displayed for each ROI (aINS: n = 83; dlPFC: n=74; vmPFC: n=54; lOFC: n=70).
b. Time-frequency decomposition of PE signals following outcome onset. Hotter colors indicate more positive regression estimates. Horizontal dashed lines indicate boundaries between frequency bands that are investigated in panels c and d. c Time course of regression estimates obtained from linear fit of BGA with PE modeled across reward and punishment conditions. Solid lines (filled areas) indicate mean (SEM) across recording sites. Horizontal bold black lines indicate significant clusters (pc?<?1?×?10?3; one-sample, two-sided Student’s t test after cluster-wise correction). d Regression estimates of power against PE, averaged over early (0–0.5?s) and late (0.5–1?s) post-stimulus windows for the lower-frequency bands (?/?: 4–13?Hz) and over the 0.25–1?s window for higher frequency bands (?: 13–33?Hz and broadband ?: 50–150?Hz). Center lines, box limits, whiskers, and crosses of the box plots, respectively represent median, interquartile range, and outliers of the data distribution from the n recording sites. Stars indicate significance (all p values?<?0.05) of regression estimates (one-sample, two-sided Student’s t test). Error bars correspond to inter-sites SEM and dots correspond to individual recording sites.
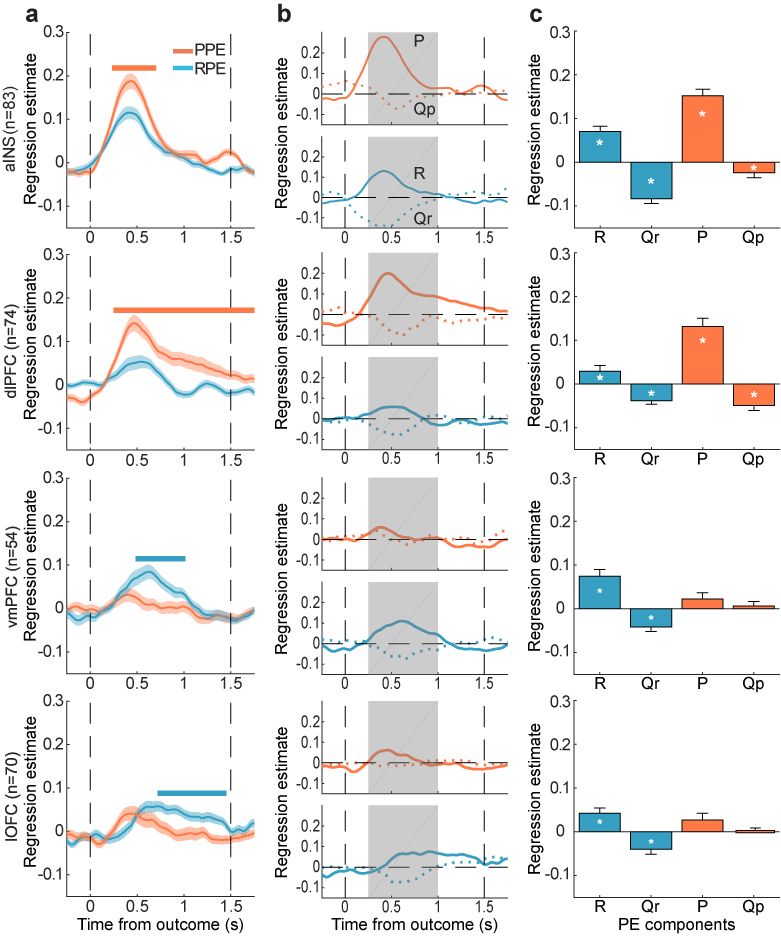
a. Time course of regression estimates obtained from linear fit of BGA with PE modeled separately for the reward (blue) and punishment (red) conditions (PPE punishment prediction error, RPE reward prediction error). Horizontal bold lines indicate significant difference between conditions (blue: RPE>PPE; red: PPE>RPE; pc<0.05). Shaded areas represent inter-sites SEM.
b. Time course of regression estimates obtained from a linear model including both outcome (solid lines) and expected value (dotted lines) components for both reward (R and Qr) and punishment (P and Qp) PE. c Regression estimates averaged over the 0.25–1s time window (represented as shaded gray areas in panels b). Stars indicate significance (*p<0.05, one-sample, two-tailed Student’s t test). Error-bars correspond to inter-sites SEM and dots correspond to individual recording sites. The sample size (n) used to derive statistics in all panels was: aINS: n=83 sites; dlPFC: n=74; vmPFC: n=54; lOFC: n=70.
Reference :
Anatomical dissociation of intracerebral signals for reward and punishment prediction errors in humans.
Gueguen MCM, Lopez-Persem A, Billeke P, Lachaux JP, Rheims S, Kahane P, Minotti L, David O, Pessiglione M, Bastin J.
Nat Commun. 2021 Jun 7;12(1):3344. doi: 10.1038/s41467-021-23704-w. PMID: 34099678 Free article.
Date
- Imprimer
- Partager
- Partager sur Facebook
- Partager sur Twitter
- Partager sur LinkedIn
- Share url